CHOROPLETH MAPS
Turn a column of numbers into a map
Paste values for countries or regions, pick how they should be coloured, and get a map back as SVG or PNG. Nothing to install, and no JavaScript mapping library.
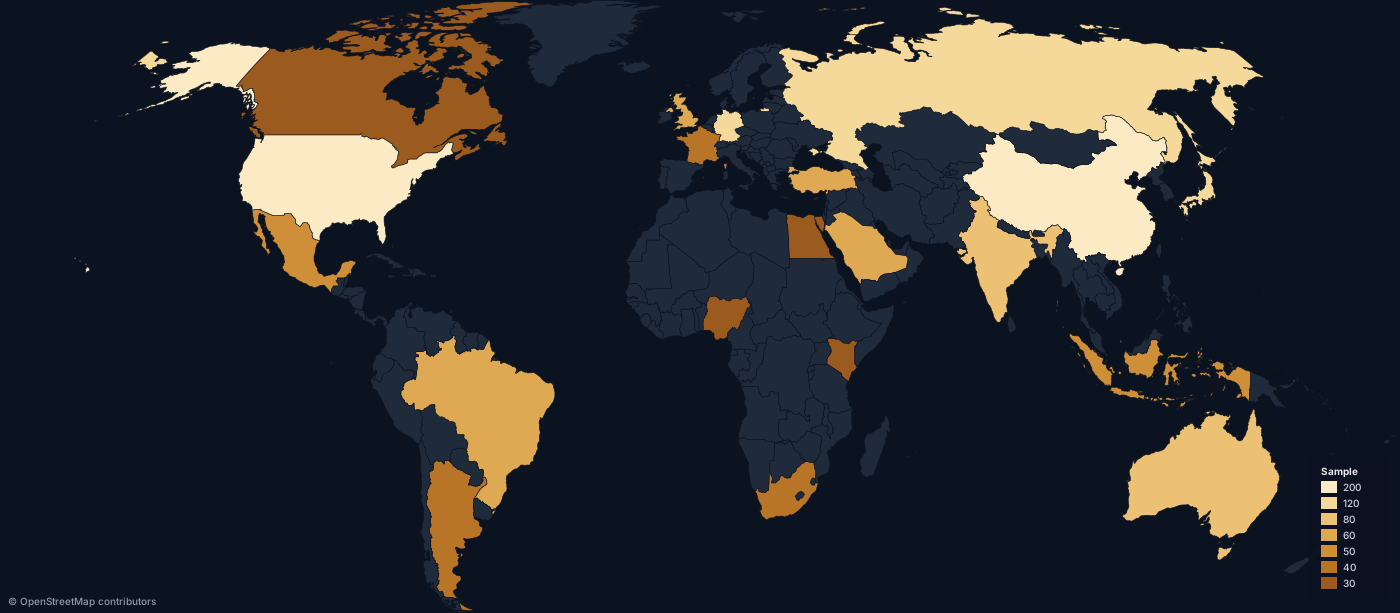
Founding members get a year free. No credit card. Magic-link sign-in.
The data is the URL
A choropleth colours each region by its value. Population, election results, emissions, revenue, life expectancy, survey answers — anything with one number per place.
Give maproll id:value pairs and it picks the bins, draws the legend and returns the image.
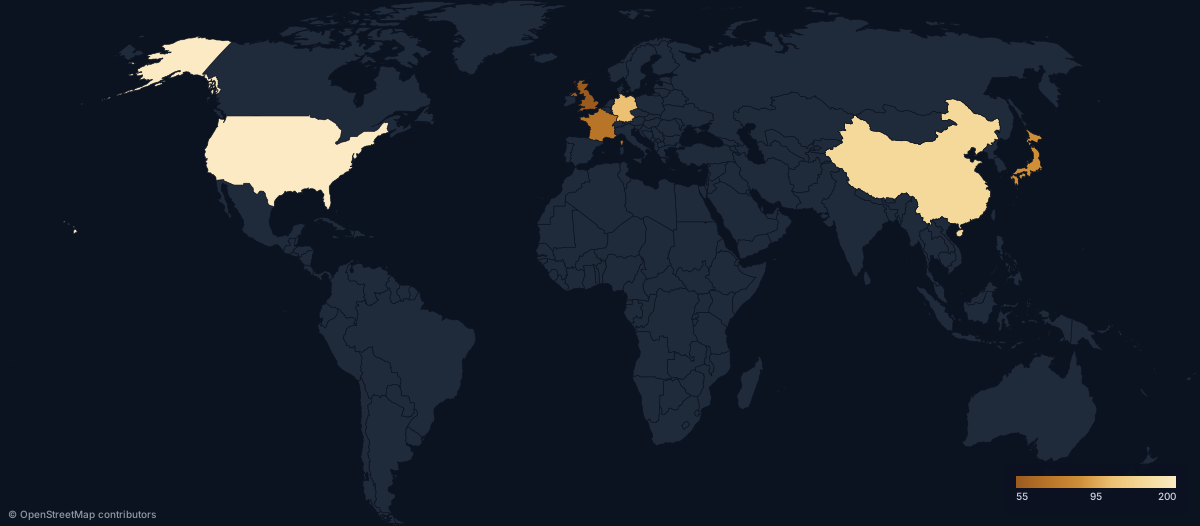
GET /map.svg?scope=world&data=US:200,CN:150,DE:95,FR:80
Countries, states, provinces, blocs
177 countries, subdivided
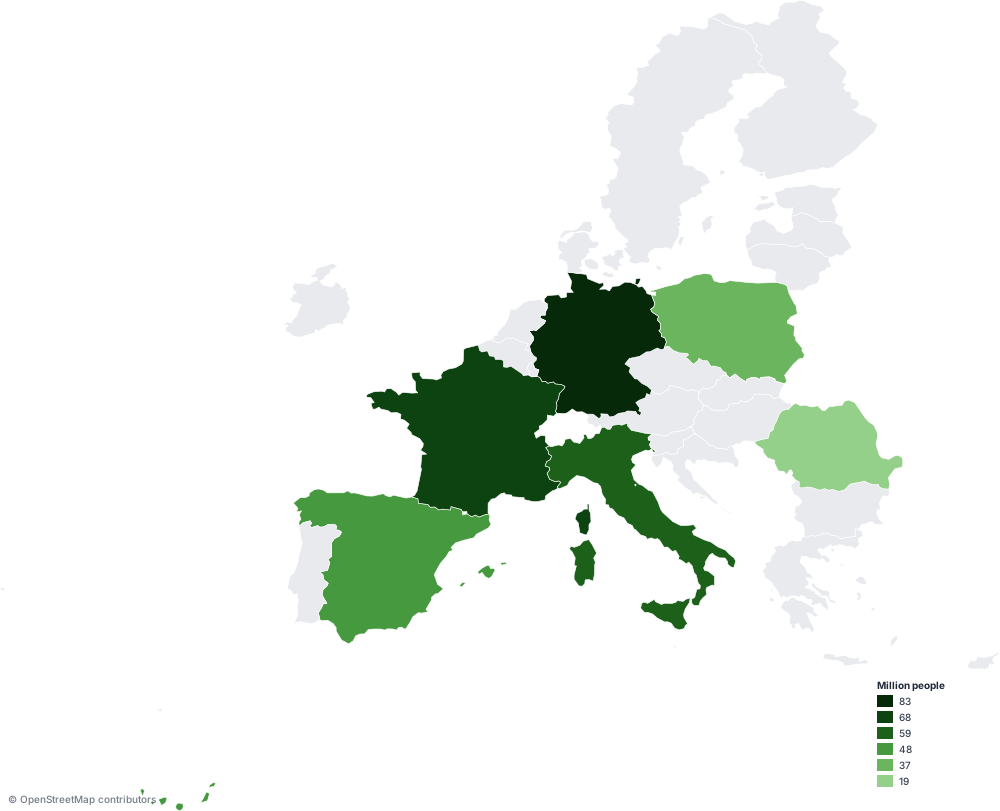
Map the world by country, or go inside one of 177 countries and map its states, provinces or regions by ISO 3166-2 code — RO-B, US-CA, DE-BY.
16 ready-made groups
scope=EU, NATO, ASEAN, G20, BRICS, AFRICA and ten more. One token gives you the member set, already filtered.
Up to 5,000 regions
Around 40 to 60 fit comfortably in a URL. Past that, POST the same data as JSON or CSV and get the same map back.
Choose how the numbers are binned
Sequential for low-to-high, diverging when values cross a midpoint, categorical for groups rather than magnitudes.
Four ways to cut the bins: quantile, Jenks natural breaks, equal interval, or breaks you set yourself.
GET /map.svg?scope=world&data=...&classification=jenks&legendLayout=continuous
When the value is a category, not a number
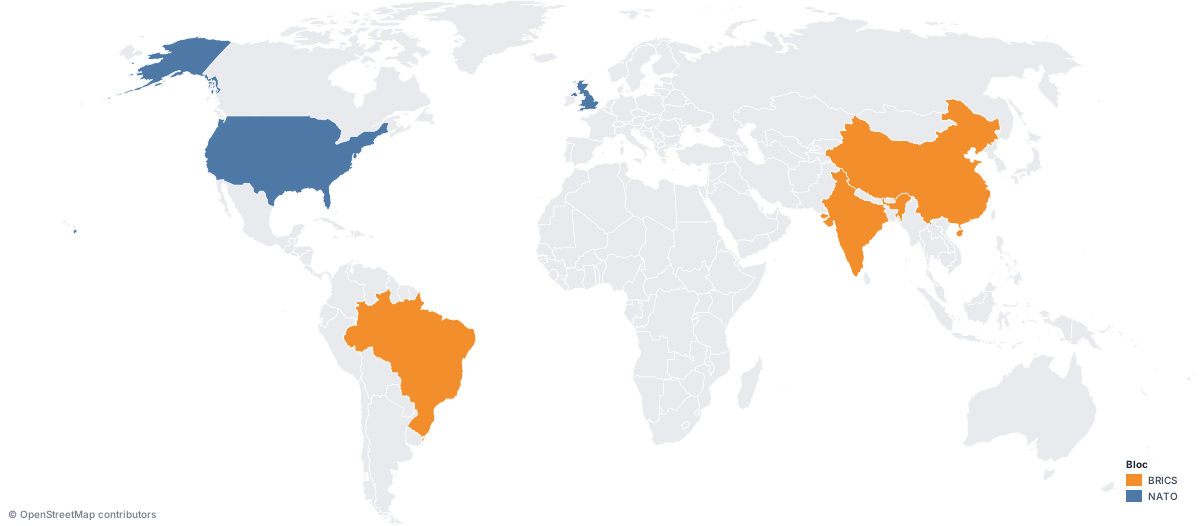
Pass labels instead of numbers — data=US:NATO,CN:BRICS — and maproll switches to a categorical palette and legends the groups.
Eight distinct colours before the palette repeats, so keep categories few and the map readable.
Then add the rest of the story
Proportional circles
Size circles by a second variable on top of the colour fill. Area scales with the value, so a 10× number looks 10× bigger.
Routes and flows
Great-circle lines for travel and trade. Add sea to a route and it follows real shipping lanes through Suez, Panama and Malacca.
Cartographic polish
Region labels, north arrow, scale bar, graticule, five projections, six themes and pattern fills for the regions with no data.
One map, one link
Every map is a URL. Copy it into an image tag and it renders in a story, a README, Notion, a newsletter, a dashboard or a report — no embed script, no iframe.
SVG stays sharp at any size and prints cleanly. PNG is the one to use for email and social, where SVG is not rendered.
GET /map.svg?scope=world&data=US:200,CN:150,DE:95
Make your first choropleth
Bring the numbers. maproll brings the boundaries, the scale and the legend.
Create a free accountRead the API docsBuilding it from code? The same map is one GET request away — see the static map API.