Maps as a URL. Type what you want.
Make a clean map from a URL, or describe it in plain English. Copy the link, drop it in a story, a README, or a newsletter. No JavaScript. No GIS.
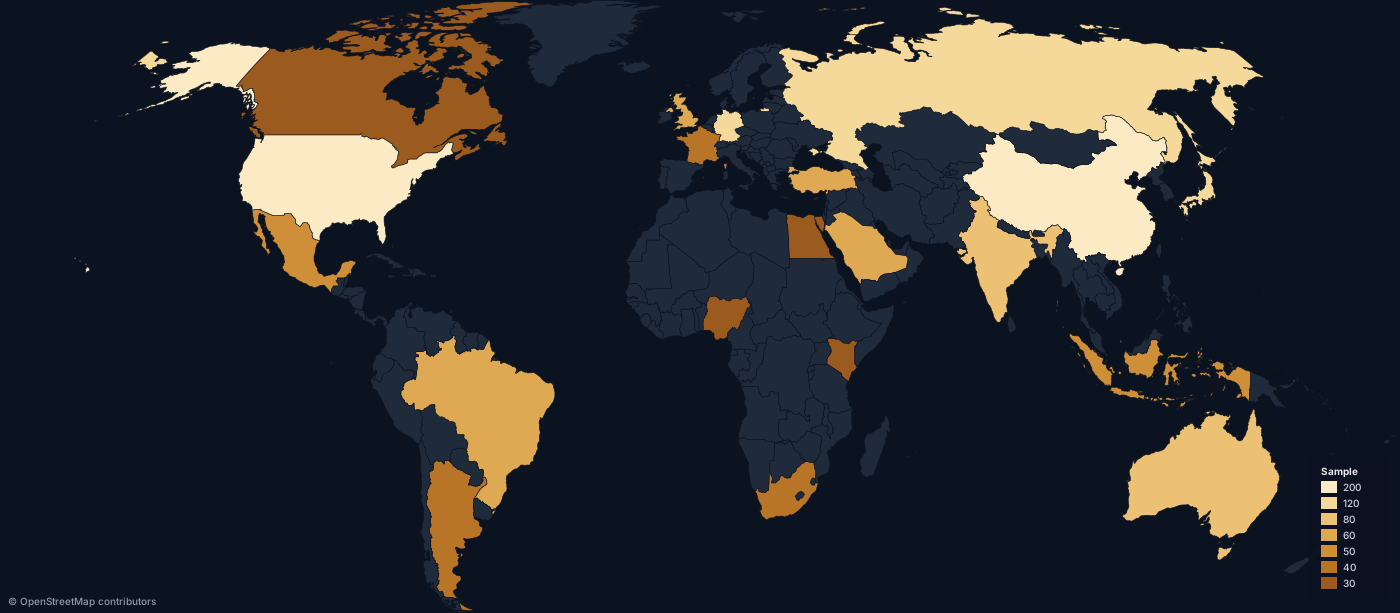
Founding members: your account stays free for a full year. No credit card. Magic-link sign-in, no password.
THREE WAYS IN
For developers
Build maps with a single URL, or POST your values as JSON or CSV. Stable, cached SVG and PNG embed anywhere an image tag works — no JavaScript, no SDK, no tile servers.
Perfect for production sites, dashboards, automated reports.
For journalists & storytellers
Describe your story in plain English. AI generates the map with a live preview, then refines conversationally — "make Ukraine blue", "add airports", "highlight shipping lanes". Save your work into projects, copy a permanent URL, embed anywhere.
For AI agents
One line of MCP config and Claude, Cursor or VS Code can build a real map from your data — and hand back a URL you can embed, not a throwaway image file.
Why teams pick maproll
Live in an image tag
Cold renders under 300 ms. Cache hits under 50 ms. One URL becomes an image. No SDK to load.
Looks published
Six modern themes, three color scales, four ways to bin the data. Borders stay clean when the map simplifies.
Borders that don't fall apart
Stable region IDs and the right level of detail for the size you ask for, so a thumbnail and a full-page render both look right.
Trade and routes, not just countries
Great-circle flows, or sea routes that thread Suez, Panama and Malacca. Style with color, dashed lines, arrows.
Icons when a color fill isn't enough
30 built-in icons — airports, factories, hospitals, ports, and more. Optional NATO military symbols when the story needs them.
One URL. Anywhere an image works.
READMEs, Notion, newsletters, dashboards, web apps. One URL, one image tag.
FOUNDING MEMBERS
A full year free for founding members
Accounts are free today and paid later. Join now and your account stays free for a full year — multi-map projects, AI chat, and everything we ship next.
Claim founding accessNo credit card. Magic-link sign-in, no password. Founding pricing locks in your year — early members get the best rate when we introduce paid plans.
A single URL is the whole API
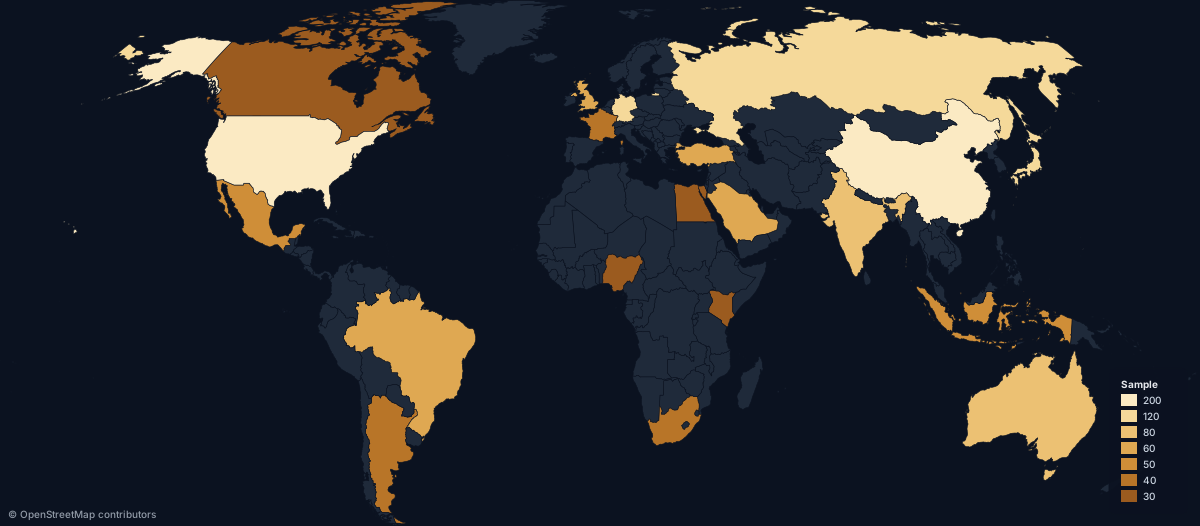
Every map is a URL. This image was rendered live by maproll — copy the URL into any image tag and you have a map.
GET /map.svg?scope=world&data=US:200,CN:150,DE:95&theme=dark
Built for real work
Journalists & newsrooms
Break news faster. Turn a story brief into a publishable visual in minutes.
Researchers & think tanks
Geopolitical, economic and logistics maps with the cartographic polish a report needs.
Developers & product teams
Reliable map endpoints you can use in production today, no GIS stack required.
Content creators
Beautiful maps for newsletters, reports and social media — not a spreadsheet heatmap.
More than country colors
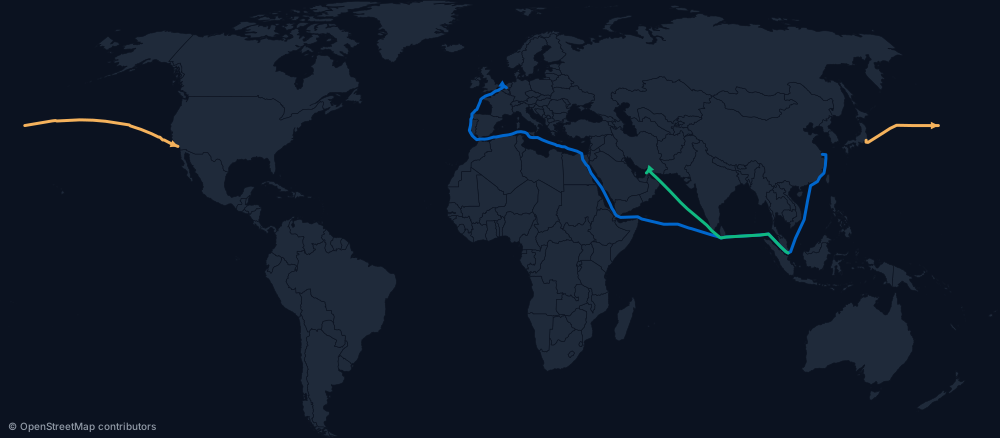
Sea-aware routes and great-circle flows for trade, logistics and travel data — Suez, Panama and Malacca handled automatically.
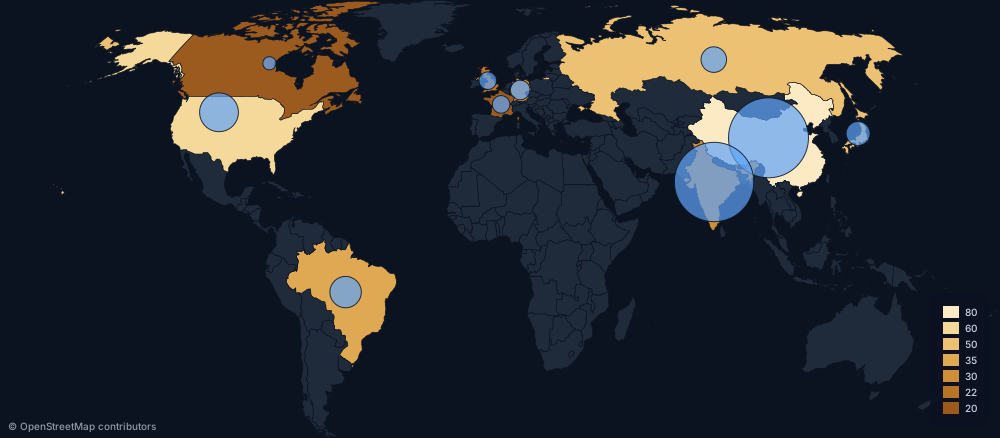
Proportional symbols for dual-encoding two variables on one map.
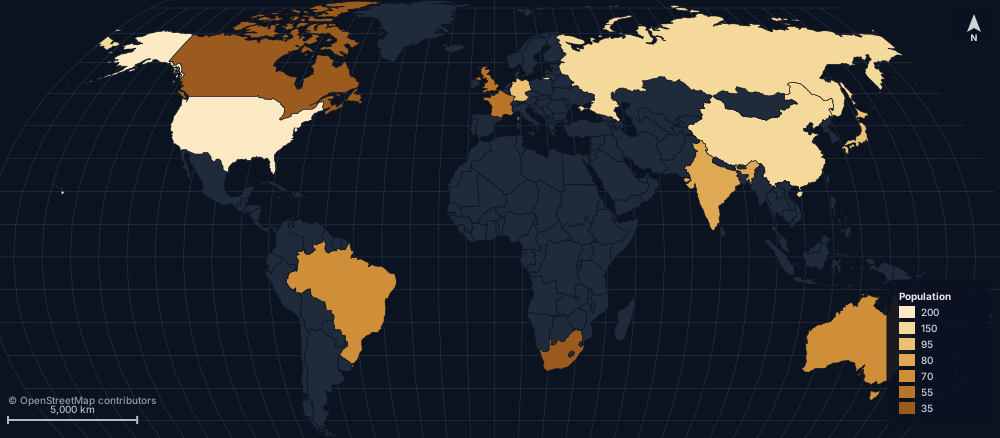
North arrow, scale bar and graticule overlays — the cartographic polish a published report needs.
LATEST FROM MAPPED
The most recent maps
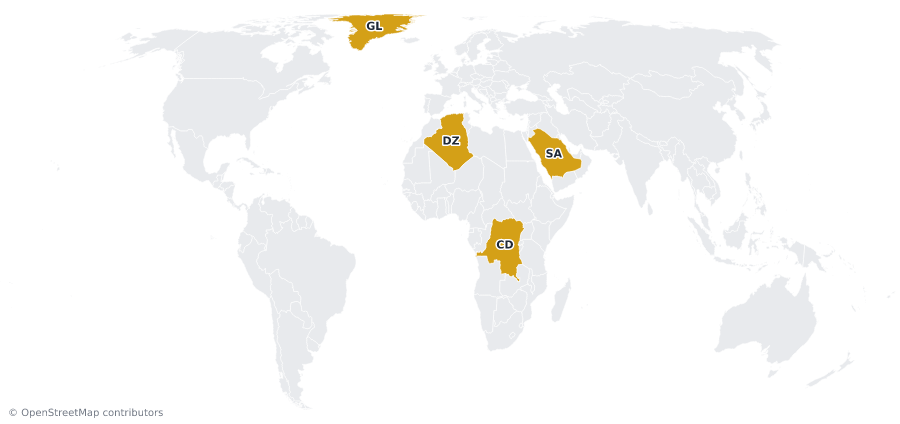
Greenland is the size of Saudi Arabia. Mercator disagrees.
Four countries, each about 2.2 million km². On Mercator, Greenland is drawn fifteen times bigger than Saudi Arabia. Equal Earth puts them back in proportion.
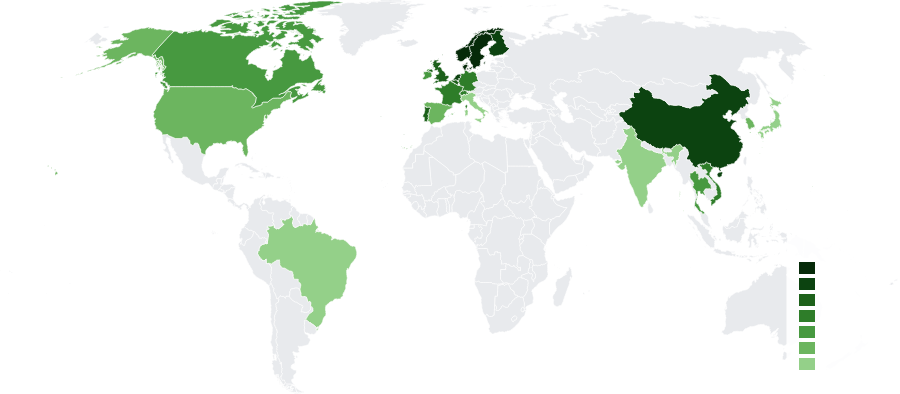
Where every new car is going electric
In Norway nine in ten new cars are electric. In the US it's one in ten, and in Japan barely one in twenty-five.
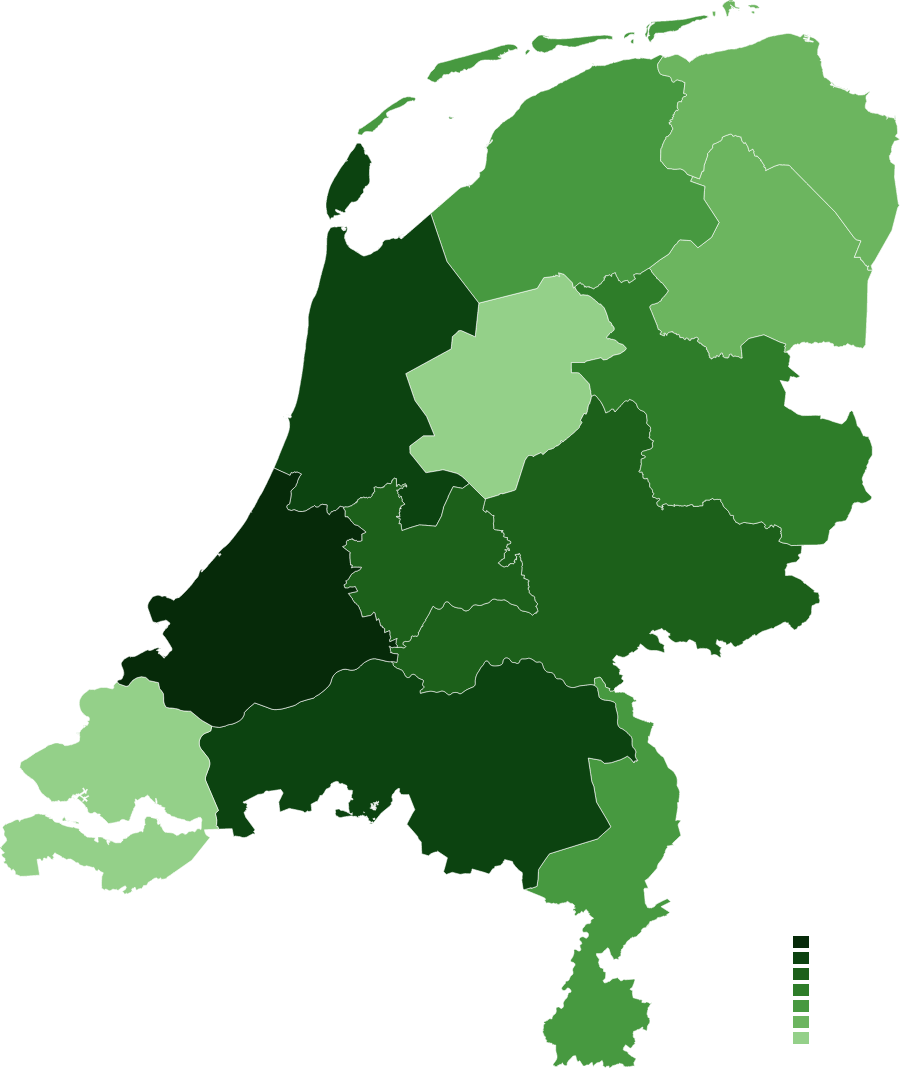
Nearly half of the Netherlands lives in three provinces
Zuid-Holland alone holds almost 10× the people of Zeeland — three coastal provinces hold nearly half the country.
MAPPED — OUR WEEKLY MAP SERIES
One dataset. One map. In your inbox every week.
We turn the numbers behind the news — how big Greenland really is, EV adoption, Dutch provinces — into clean, shareable maps. Subscribe and get the new one each week, plus the occasional product update.
Thank you. You're subscribed.
No spam, unsubscribe anytime. Read the latest at maproll.io/content.
Ready to make a map?
Create a free accountExplore the URL APIFounding members get a year free. No credit card. Magic-link sign-in.