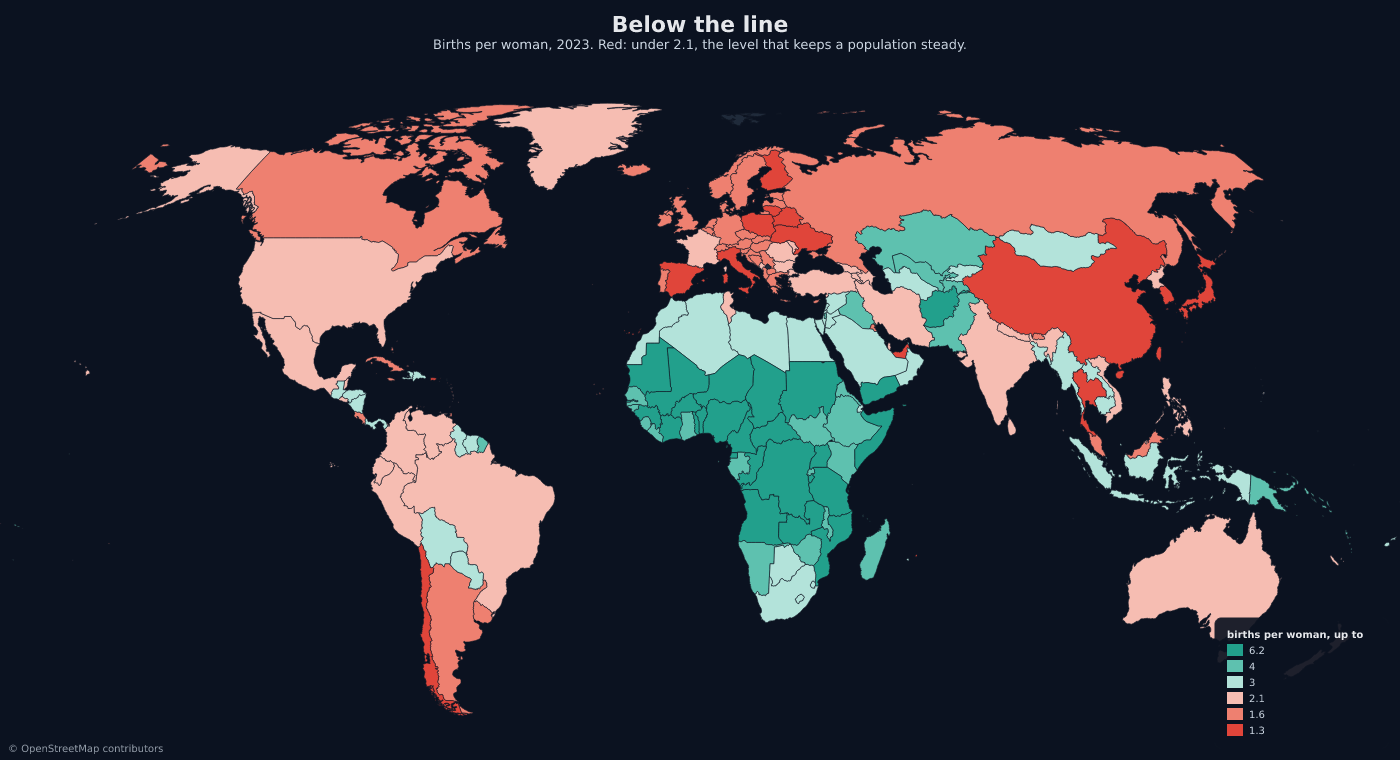
Two in three people live in a country below replacement
Welcome to Mapped — one dataset turned into one map, every week. This week: how many children a woman has, country by country.
In 1950 the average woman on earth had 4.9 children. In 2023 she had 2.25.
The number that matters is 2.1. That is roughly what a country needs, over the long run and without migration, for each generation to replace the one before it. 128 of 233 countries and territories are now under it. They are home to two people in three.

Remix this map → Opens this exact map in the editor, data included. Change the numbers, the palette, the country. It’s your copy.
What you’re looking at
The total fertility rate: the number of children a woman would have if she lived through this year’s birth rates at every age, from 15 to 49. UN estimates for 2023. Red is below 2.1, teal is above it, and the colour flips exactly at the line. The deeper the red, the fewer the births; the deeper the teal, the more. Every band is labelled by its upper edge.
The deepest red is East Asia. South Korea 0.72, Taiwan 0.87, China 1.0, Japan 1.21 — and lower still, in places too small to see here, Macao (0.66) and Hong Kong (0.72). At 0.72, 100 Korean women have about 72 children between them, roughly 35 of them girls: at that rate each generation is about a third the size of the one before. Korea’s own statisticians put 2025 at 0.80, up for a second year and still among the lowest anywhere.
Europe and the Americas are under it too. Italy and Spain 1.2, Germany 1.44, the UK 1.56, the United States and Brazil 1.62, Mexico 1.91. Chile, at 1.17, is now below Japan. The US recorded 3.6 million births in 2025, and births per woman of childbearing age hit a record low.
India crossed the line. At 1.98 the world’s most populous country is below replacement — and the UN still expects it to keep growing until the early 2060s, to about 1.7 billion. A country with lots of young adults keeps adding people for decades after families shrink. That is the lag this map can’t show.
Some of the fastest falls happened where nobody was looking. Since 1990 Iran has gone from 4.9 to 1.7, the Maldives from 6.1 to 1.6, the United Arab Emirates from 4.5 to 1.2.
The deep teal is almost all Africa. 27 countries are at 4 or above; 25 of them are in Africa, plus Afghanistan and Yemen. Somalia (6.13), Chad, Niger and DR Congo all sit near six. Africa now accounts for 35% of the world’s births — 46 million of 132 million in 2023. Off the map, the newest national count makes the point: China recorded 7.9 million births in 2025, its fewest since 1949. The UN’s estimate for Nigeria that year is 7.6 million.
And one rich country is on the other side. Israel, at 2.83, is the only OECD member above replacement.
The takeaway
Two in three people now live in a country where, at today’s birth rates and without migration, each generation would be smaller than the last.
Make this map yourself
The whole map is one maproll URL:
https://api.maproll.io/map.svg?scope=world
  &data=MO:0.66,HK:0.72,KR:0.72,CN:1.0,...,IN:1.98,IL:2.83,NG:4.48,SO:6.13
  &theme=dark&colorScale=diverging
  &classification=custom&breaks=1.3,1.6,2.1,3,4,6.2
  &legendTitle=births%20per%20woman,%20up%20to
with custom breaks splits the colours at the middle break, so the map turns from red to teal at 2.1 instead of at zero. Three bands sit below the line and three above, and the replacement line becomes a border on the map rather than a number in the copy. Remix this map → or start from scratch.
Sources: total fertility rate and births from the UN World Population Prospects 2024 (estimates for 2023), via Our World in Data; population shares use the same release’s 2023 population. The next UN revision has been postponed to 2027, so these are the latest comparable figures for every country. Many countries without complete birth registration — Nigeria among them — are modelled from surveys and censuses. India’s projected peak is the UN medium variant. Recent national figures: South Korea 2025 from Statistics Korea (Korea Times); United States 2025 from CDC/NCHS, Births: Provisional Data for 2025; China 2025 from the National Bureau of Statistics (Caixin). Replacement is about 2.1 where child mortality is low and higher where it isn’t. Next week on Mapped: subscribe below to get it first.