HONEST COMPARISON
A simpler static map API for data maps
Mapbox is a complete mapping platform, and it is very good at that job. This page is about a narrower one: turning regional data into a clean static image.
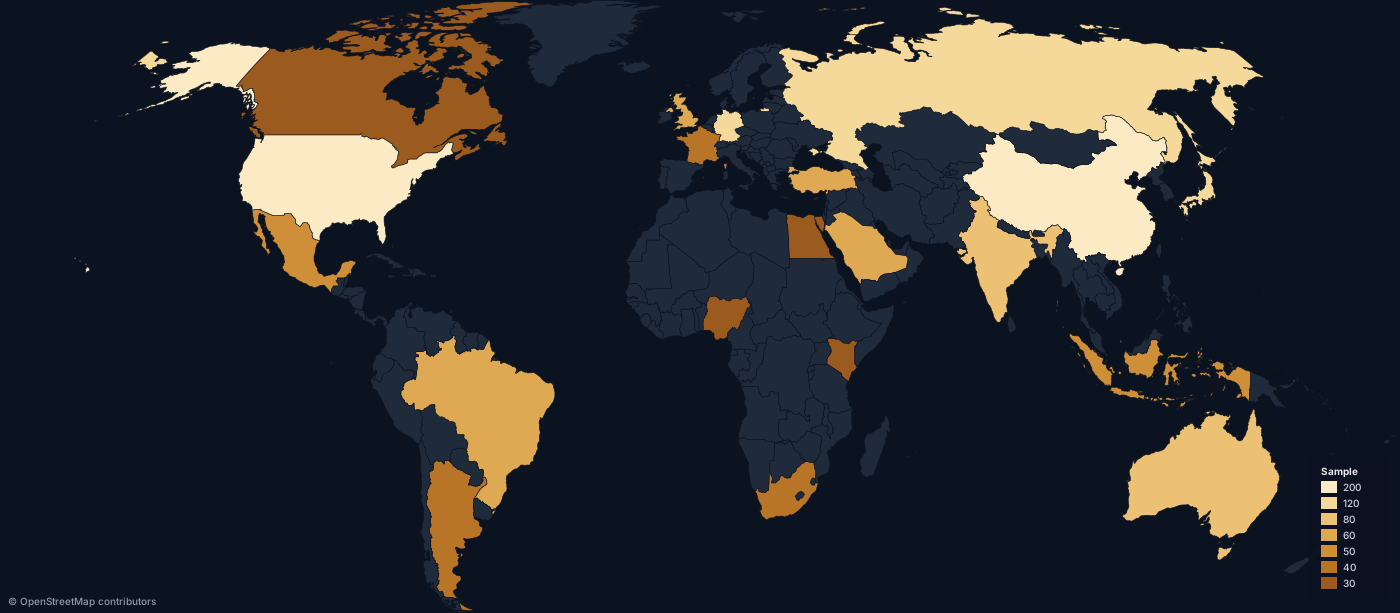
GET /map.svg?scope=world&data=US:200,CN:150,DE:95&theme=dark
What maproll does not do
If you need an interactive slippy map, turn-by-turn navigation, custom basemap styling, satellite imagery, geocoding at scale or a heavily customised map application, use Mapbox. maproll does none of those and is not trying to.
There is no basemap, no tiles, no imagery, no zoom control and no JavaScript map runtime.
maproll does one thing: regional data in, publication-ready static map out.
Choropleths, region highlights, categorical fills, proportional circles, routes and sea lanes, markers, cartographic overlays.
Where the two genuinely differ
SVG, not only raster
Static image endpoints usually return raster. maproll returns SVG directly — sharp at any size, print-ready and small — or PNG when a raster is what you need.
Statistical maps first
Nothing to initialise
No SDK, no style URL, no token in the browser. An image tag is the integration, so it works in email, READMEs and server-rendered pages.
The same map, described by its URL
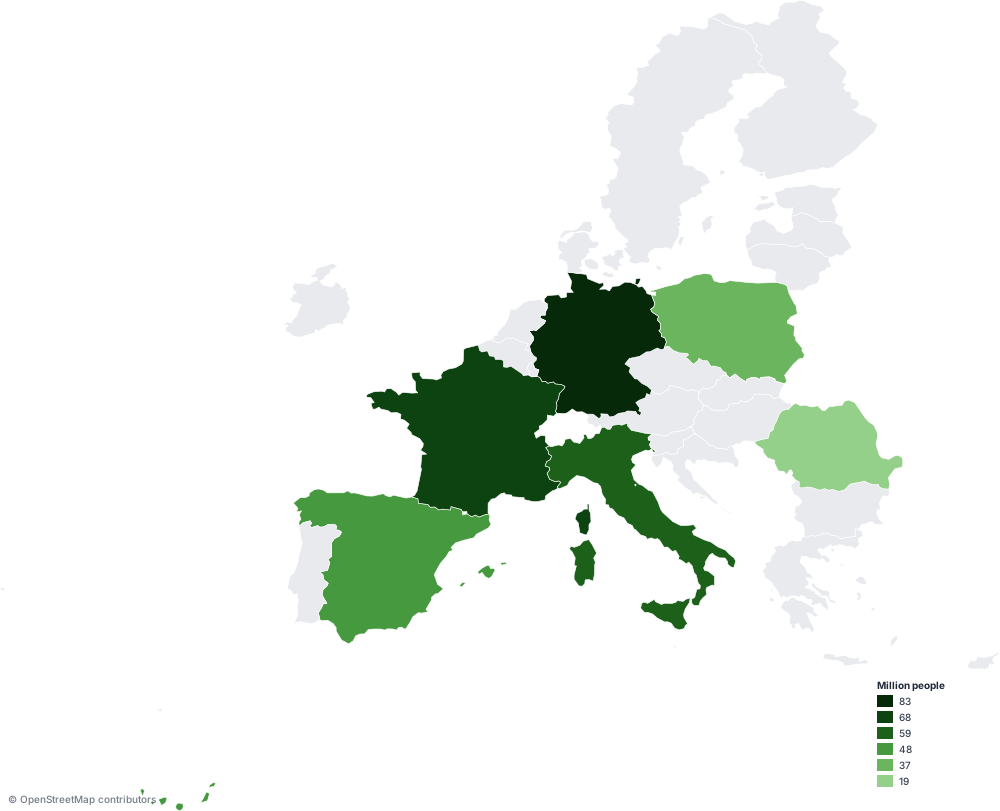
Every parameter of the map lives in the request, so the map is reproducible, diffable and cacheable. Responses carry an ETag and immutable cache headers.
Too much data for a query string? POST the same map as JSON or CSV.
Choose by the job
Use Mapbox
You need a complete interactive mapping platform — basemaps, styling, imagery, navigation, geocoding, and a map your users pan and zoom.
Use maproll
You need geographic data turned into a clean static visualisation, embedded like an image, with as little infrastructure as possible.
Try it against your own data
A different tool for a narrower problem. Paste your values and see whether it is the one you need.
Try maprollRead the API docs