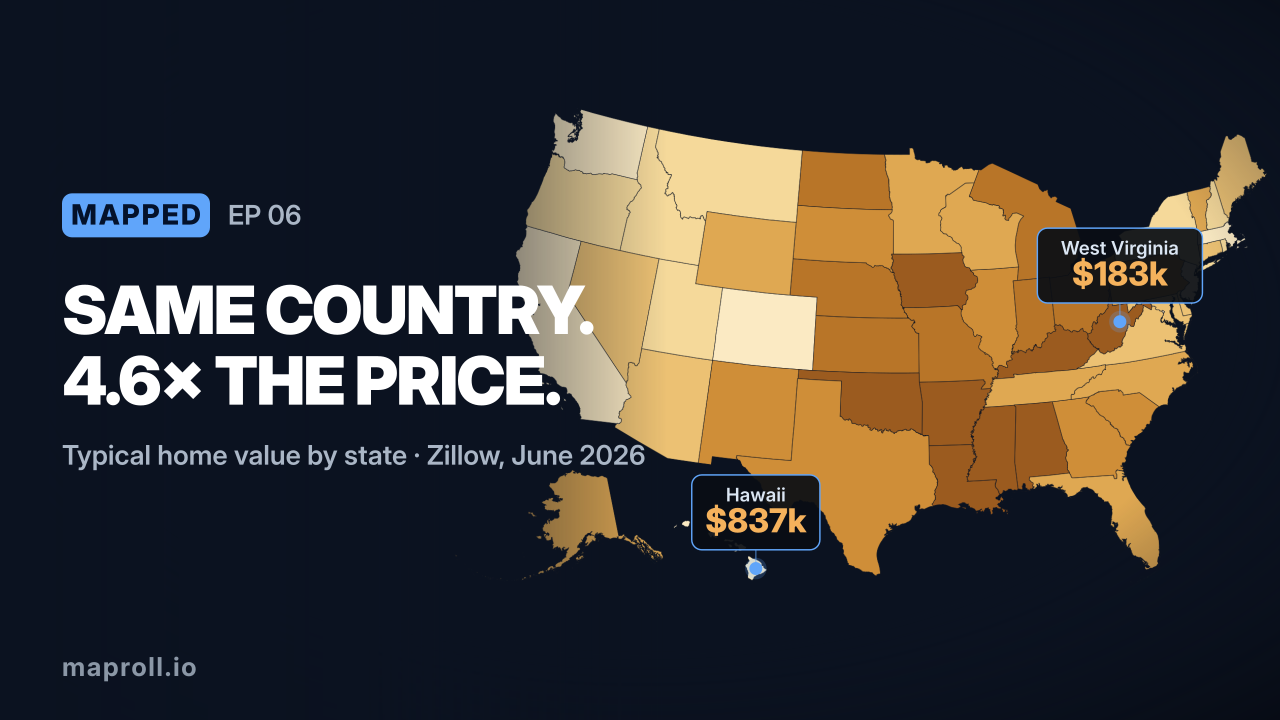
A home costs 4.6× more in Hawaii than West Virginia
Welcome to Mapped — one dataset turned into one map, every week. This week is a first: instead of the whole world, we zoom inside a single country — the price of a home in all 50 US states.
America argues about the cost of housing as if there were one number. There isn’t. The typical home in the most expensive state is worth 4.6 times the typical home in the cheapest — same country, same currency, wildly different price tag. Here’s the June 2026 map.
&title=One country%2C one housing market%3F&subtitle=Zillow typical home value by state%2C June 2026)
Remix this map → Opens this exact map in the editor, data included. Change the numbers, the palette, the country. It’s your copy.
What you’re looking at
The figure on the map is the Zillow Home Value Index — Zillow’s estimate of the typical home’s value in each state, not a median sale price.
Hawaii tops the country at about $837,000 — a chain of islands with almost no buildable land and relentless demand. California ($776k) is right behind, and together with the coastal Northeast — Massachusetts, New Jersey, New York — it forms the dark band around the edge of the map.
Look at the middle of the West, though. Idaho ($482k), Montana ($476k) and Utah ($542k) now out-price much of the East Coast — the interior is no longer the cheap alternative it’s assumed to be.
Then the map fades toward Appalachia and the Deep South. West Virginia is the cheapest state at about $183,000 — one Hawaii home is worth nearly five of them. Mississippi, Louisiana, Oklahoma and Arkansas all sit under $230k. And notice the giants: fast-growing Texas ($303k) is still below the US figure of $373,000, with Florida ($378k) barely above it.
The takeaway
For what a house costs, the state you’re in matters more than the country — a nearly fivefold gap runs from the islands of Hawaii to the hills of West Virginia.
Make this map yourself
This is the same maproll that maps the world, just pointed at one country’s regions. The whole thing is a single URL — copy it and change a number:
https://api.maproll.io/map.svg?scope=US&data=US-HI:836741,US-CA:775549,US-TX:302999,US-FL:378126,US-NY:525947,US-WV:182704,US-MS:198428&theme=light-blue&legend=true&legendTitle=Typical%20home%20value
Swap scope=US for FR, DE, JP or RO to map another country’s regions instead. Remix this map → or start from scratch.
Source: Zillow Home Value Index (ZHVI), typical value of all homes, June 2026 snapshot — a smoothed, seasonally adjusted estimate of the typical home value, not a median sale price. Next week on Mapped: subscribe below to get it first.